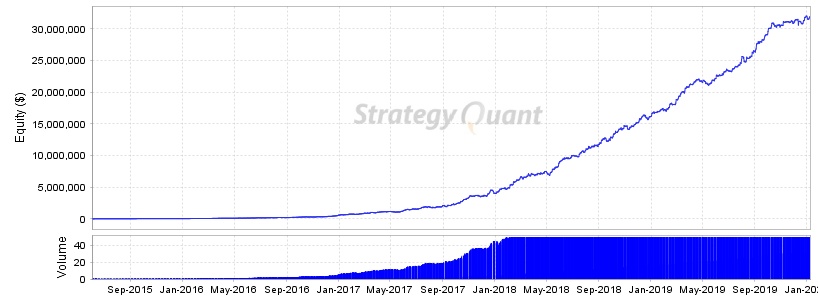
Fortnight Profit System on 1% Risk on EQUITY
Risk fixed % of account: 1.0%, 1.0 lots, 50.0 max. lots
Source: MMSimulation| Symbol | Portfolio | Period | unknown : 01.06.2015 - 08.01.2020 |
|---|---|---|---|
| Initial deposit | 10,000 | ||
| Parameters | - | ||
Total Profit
$31,890,011
Profit in pips
108648.4 pips
Yrly Avg profit
$ 6833474.49
Yrly Avg % ret
194421.66 %
CAGR
283.68 %
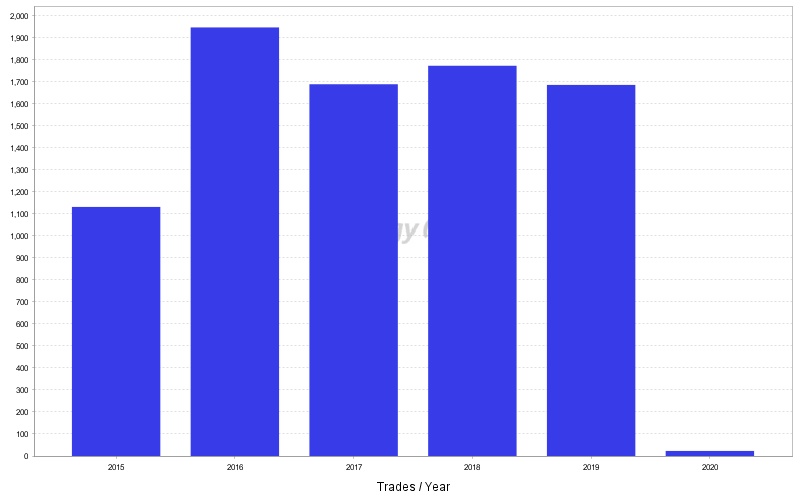
# of trades
8245
Sharpe ratio
0.01
Profit factor
1.39
Return / DD ratio
26.93
Winning %
84.98 %
Drawdown
$ 1183983.2
% Drawdown
180.53 %
Daily Avg profit
$ 18937.06
Mthly Avg profit
$ 569464.5
Average trade
$ 23835.07
Annual% / Max DD%
1.57
R Expectancy
0.17 R
R Exp score
308.16 R
SQN
8.3
SQN score
23.2
Monthly Performance ($)
| Year | Jan | Feb | Mar | Apr | May | Jun | Jul | Aug | Sep | Oct | Nov | Dec | YTD |
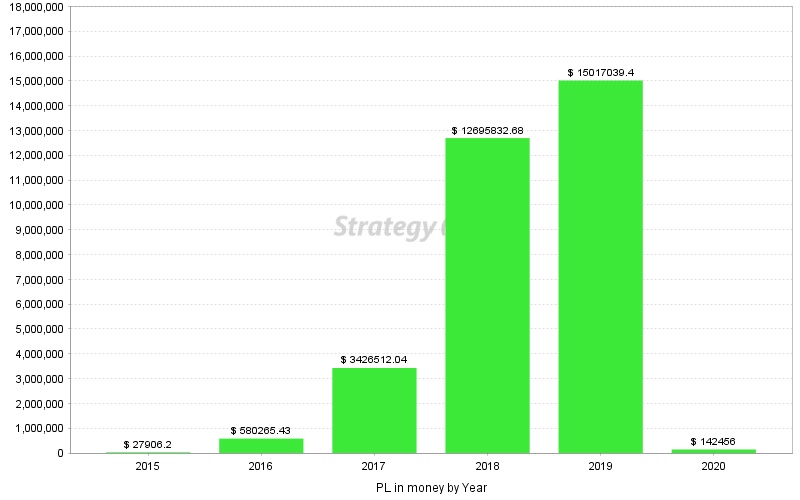
| 2020 | 142456 | 0 | 0 | 0 | 0 | 0 | 0 | 0 | 0 | 0 | 0 | 0 | 142456 |
| 2019 | 397253.8 | 1874782.2 | 2146771.7 | 589679.2 | 907511.9 | 956190.2 | 1815023.2 | 1832077.6 | 2141909.3 | 1592536.3 | 268439.9 | 494864.1 | 15017039.4 |
| 2018 | 1088495.73 | 1562540.75 | 284225.3 | 360011 | 1772508.3 | 849140.2 | 1323549.1 | 819403 | 789919.7 | 1616783.6 | 1017747.5 | 1211508.5 | 12695832.68 |
| 2017 | 139570.86 | 130196.31 | 194087.71 | 58719.99 | 248162.8 | 188794.06 | 357512.63 | 143234.61 | 324535.55 | 1234627.18 | -29719.71 | 436790.05 | 3426512.04 |
| 2016 | 7864.78 | 13276.99 | 23982.2 | 13134.73 | 26580.88 | 32621.46 | 24258.34 | 25833 | 66124.02 | 31078.68 | 36939.42 | 278570.93 | 580265.43 |
| 2015 | 0 | 0 | 0 | 0 | 0 | 2164.81 | 3038.92 | 4151.77 | 7539.78 | 3866.7 | 1652.73 | 5491.49 | 27906.2 |
Stats
Strategy
| Wins/Losses Ratio | 1.22 | Payout Ratio (Avg Win/Loss) | 1.14 | Average # of Bars in Trade | 0 |
| AHPR | 0.06 | Z-Score | -1.78 | Z-Probability | 96.25 % |
| Expectancy | 3867.8 | Deviation | $ 46791.78 | Exposure | -999999999 % |
| Stagnation in Days | 49 | Stagnation in % | 2.91 % |
Trades
| # of Wins | 4533 | # of Losses | 3712 | # of Cancelled/Expired | 0 | ||
| Gross Profit | $ 114205063.49 | Gross Loss | $ -82315051.74 | Average Win | $ 25194.15 | Average Loss | $ -22175.39 |
| Largest Win | $ 385113 | Largest Loss | $ -279879 | Max Consec Wins | 17 | Max Consec Losses | 15 |
| Avg Consec Wins | 2.27 | Avg Consec Loss | 1.86 | Avg # of Bars in Wins | 0 | Avg # of Bars in Losses | 0 |
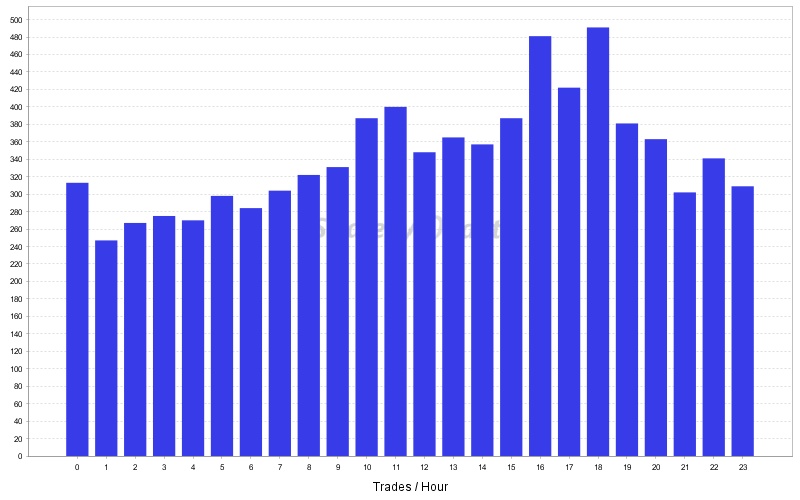
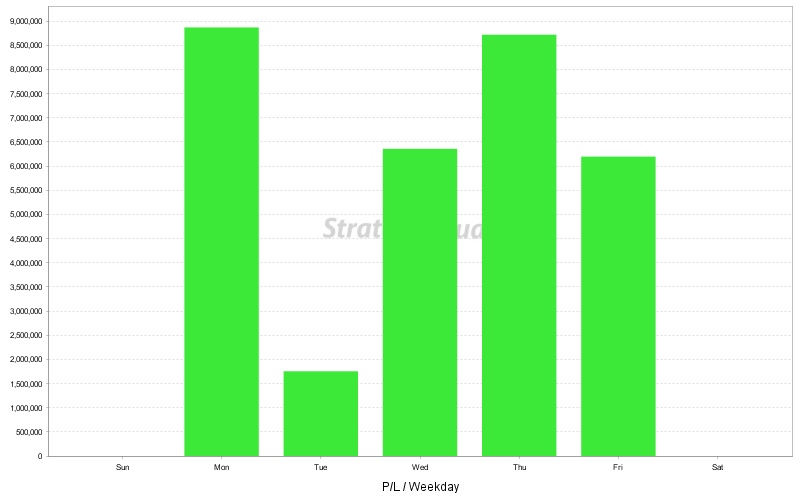
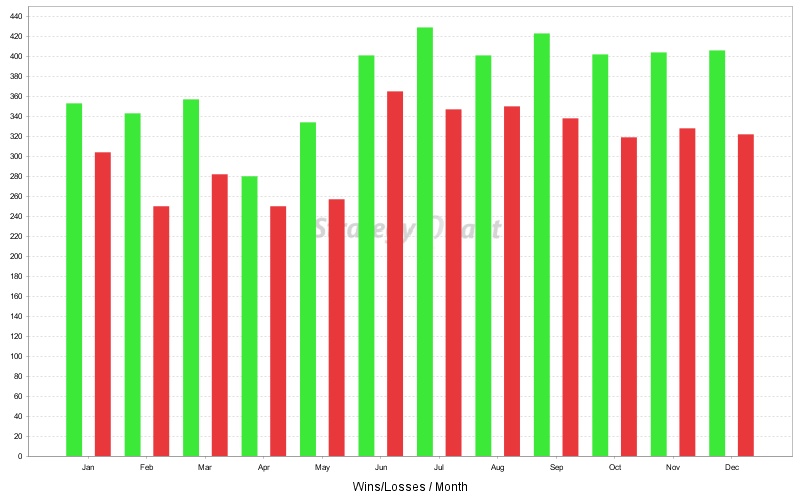
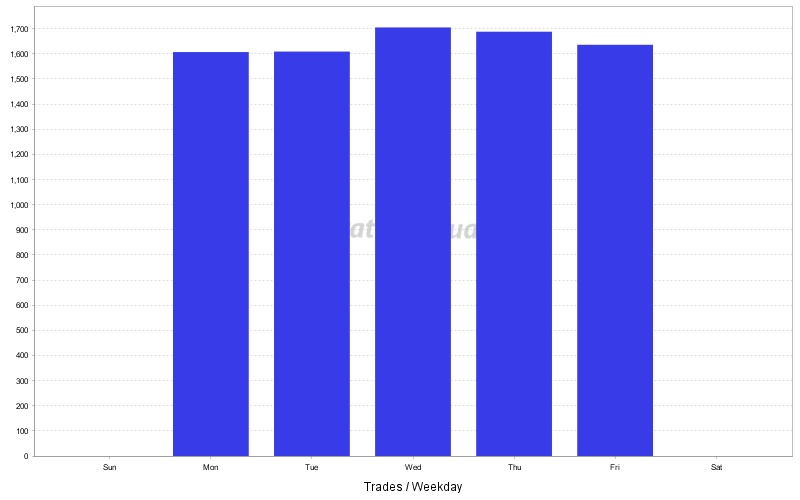
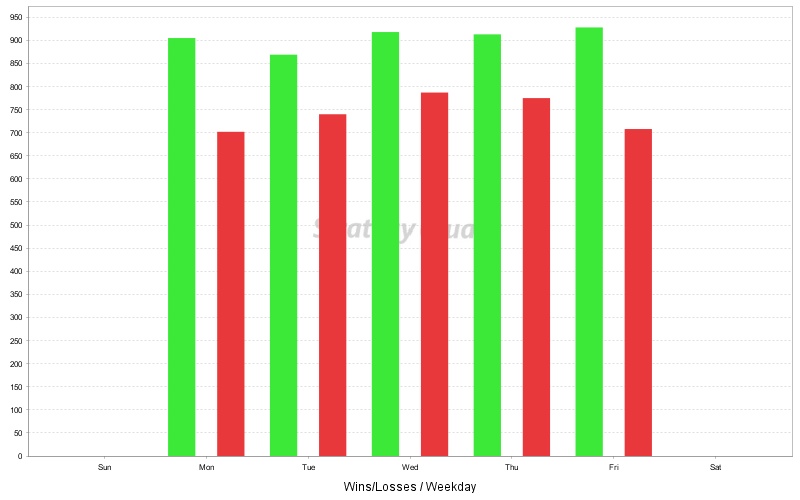
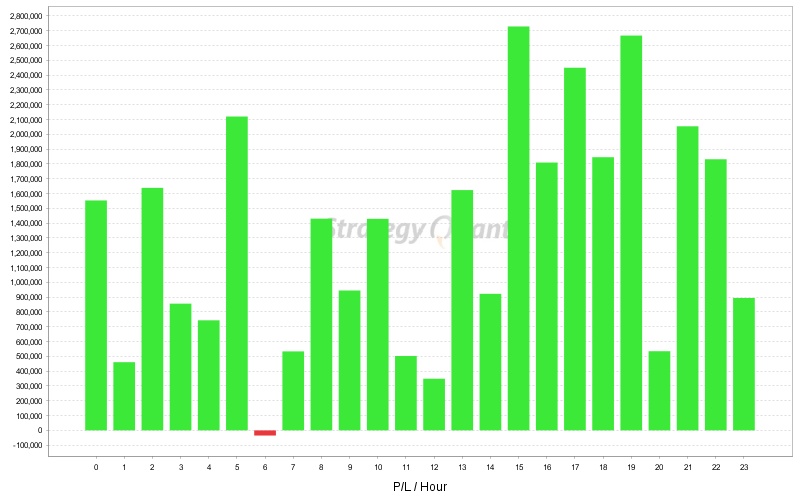
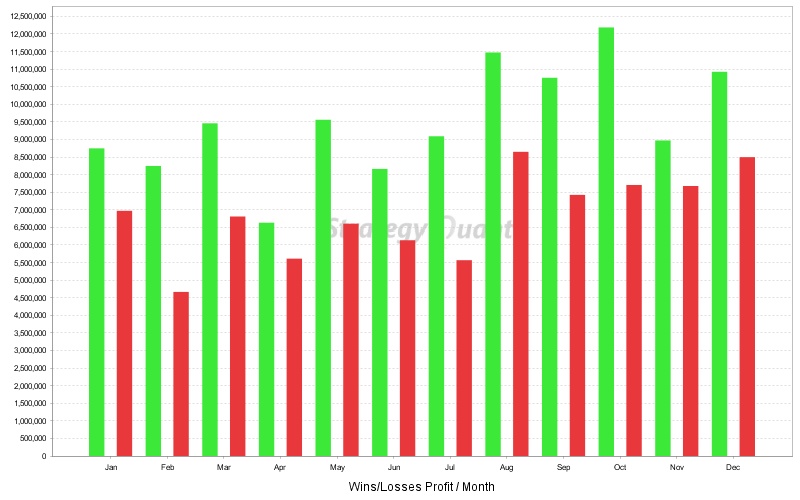
Charts
Click on the chart to see bigger image